HaRe Group
HaRe Group
By Simon Hare on Thursday, May 19th, 2016 in Salary Structures, Newsletters, All Categories.
Click here to download: PDF version
There is always tension between a remuneration budget and investing in talented employees. How much do you have to spend to retain your best people?
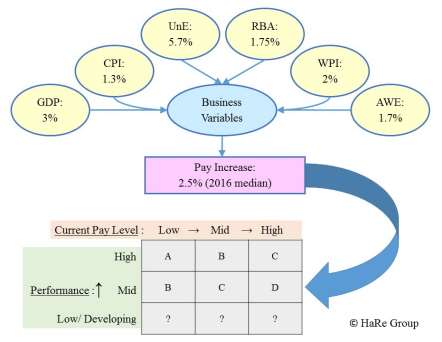
The above illustration identifies some of the latest economic indicators that business leaders may consider when making remuneration budget and review decisions – viz: growth in Gross Domestic Product (GDP); the Consumer Price Index (CPI); the unemployment rate (UnE); the RBA’s cash rate (RBA); the Wage Price Index (WPI); and the increase in Average Weekly Earnings (AWE).
However, there are also “Business Variables” that may dominate decision making. In particular:
The solution becomes even more complex in diverse organisations that have multiple responses to these questions.
Recent research by HaRe Group has revealed that the 2016 median increase in remuneration budgets (excluding awards and EAs) is 2.5%, which is down from 3.0% last year. Of course, this median is the middle value in a range of percentages – some organisations will add less to their budgets, and some will add more, but relatively few employers will increase their 2016 budgets more than 3.5%.
So how should this meagre increase be distributed amongst employees? For many years (literally decades), many organisations have applied a “salary increase matrix” that helps their decision making. The 9 cell grid in the illustration shows a simple example of a common distribution:
The pay level is often calibrated within a market based remuneration structure – an array of remuneration ranges that have benchmark positions anchored to jobs in reputable market surveys.
The performance level is usually measured with reference to the employer’s performance management system. However, an increasing number of organisations are excluding performance from their pay review formula, so the performance dimension disappears from their matrix. Instead, some organisations are more frequently increasing the remuneration paid to their best employees.
Another reality is that a growing number of employees don’t receive any pay increases.
Of course, specific pay decisions should be made about people who are new in their positions and still developing their skills. Some of these employees could be future stars who need special attention in every pay review.
Who said remuneration management was just a numbers game?