HaRe Group
HaRe Group
By Simon Hare on Thursday, January 30th, 2020 in Incentive Pay, Newsletters, All Categories.
Click here to download: PDF version
A recent report on ABC News suggested that companies are being “overcharged” by the executives they employ. Yes, there are a few extreme cases that are difficult to comprehend, but the following data presents a consistent reality for the majority of Australia’s top CEOs and Managing Directors.
The available 2019 data1 on top executives’ pay within the S&P/ASX200 includes:
| Fixed Remuneration Package [aka TEC, FAR, etc.] (AU$,000)2 |
Annual revenue (AU$M)3 | |
|
|
|
|
| • 25th percentile = | 930 | 420 |
| • Median = | 1,335 | 1,465 |
| • 75th percentile = | 1,770 | 4,775 |
| • 90th percentile = | 2,245 | 16,990 |
The median of Fixed Remuneration Package (FRP) has barely changed since 2016. During the last four years, the median has moved in a range of $1,330-1,360M. In 2019, the median rate within the S&P/ASX200 was equivalent to one dollar for every $1,090 of revenue4. (Please note: this rate is variable across industry sectors – eg. food & staples retailing has a much higher revenue base).
While this FRP rate is an insufficient measure, it can still be indicative of year-on-year trends. The chart below tracks CEO/MD remuneration as a percentage of company revenue within the S&P/ASX200 from 2016 to 2019.
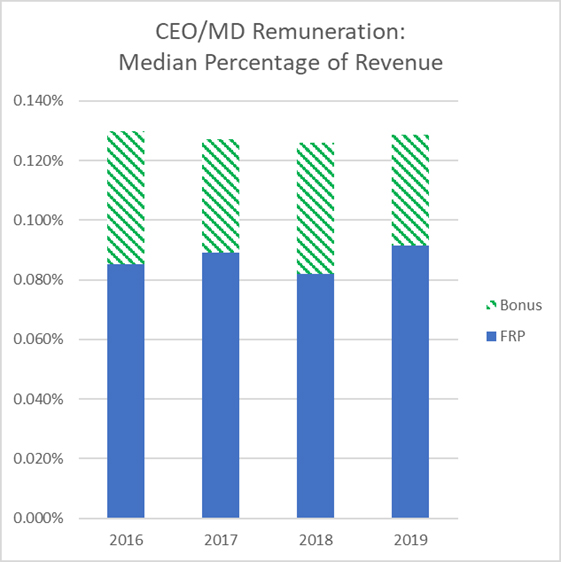
During these four years, the FRP “take” looks very similar – even more consistent is Total Annual Remuneration (TAR, the sum of FRP and Bonus).
It’s also worth noting that the median rate for all companies under the S&P/ASX200 was one FRP dollar for every $220 of revenue (about 0.45% of revenue). This simplistic comparison indicates that the big company CEO/MDs take proportionally less FRP than the heads of smaller companies.
The matter of companies being overcharged by big company CEO/MDs (as suggested in the ABC News report) can also be addressed in economic terms. In particular, we live in a market economy where the price for almost every product or service is influenced by supply, demand and opportunity cost, where buyers and sellers (of talent in this case) make agreements to trade.
Embedded in the executive pay puzzle is performance based variable remuneration – ie. annual bonuses (in cash or equity) and long term incentives (typically share based). While the S&P/ASX200 data shows a wide range of payments made for volatile company performances, overall TAR practices year-on-year seem very consistent. Nevertheless, the challenge for any Board is to prove a robust alignment between business performance measures and executive rewards. These measures should be meaningful to shareholders, and be quantitative, impartial, and free from third party influence.
Executive pay is an object of our market economy – however, there have been some prominent suggestions that more regulatory intervention and a greater degree of prescription will be required to “shift” variable remuneration practices. (In particular, the intervention of BEAR/FAR in the finance sector).
Rather than losing control of executive pay, Boards should establish meaningful performance targets, as well as vesting conditions that would better reflect the longer-term impact that most executives should have on business performance.